Datto RMM – Better Email Alerts
Recently I had been working with Datto on getting webhooks added to Datto RMM. Have a check of the video here to see some basic use cases.
I wanted to make something to demonstrate a more advanced use case with Webhooks so thought I would write a script that solves a problem that has been annoying me in Datto RMM for a long time. The standard email alerts in Datto RMM are very basic and you can’t customise them. To solve this issue I take a webhook from a Datto RMM alert and send it to an Azure PowerShell Function App. I then go and retrieve additional data from the Datto RMM API and then process that data into a more flexible email and then send that to a support address.
I have created this function in a modular way so you can turn different sections on and off per monitor. I also have written it to work as a scaffold to let you extend it yourself in the future. For example for a backup monitor you could have the function go and make a call to your backup software’s API to obtain recent errors and history which might not be available on the local device.
Features
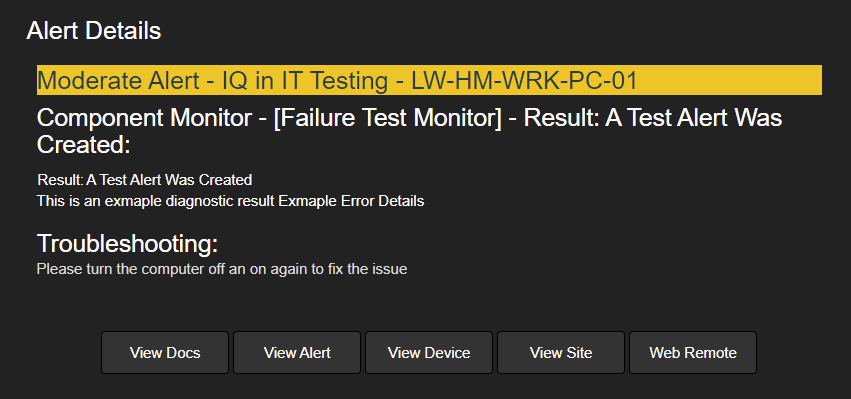
General Alert Details
The core for each alert is the general details block. This gives you an overview of the alert. Any diagnostic information. A custom field where you can enter quick troubleshooting instructions and links to different places in Datto RMM or to a linked document in your documentation system, with more detailed troubleshooting information.
Device Details
This provides some more details on the device such as last logged in user, last reboot and IP addresses.

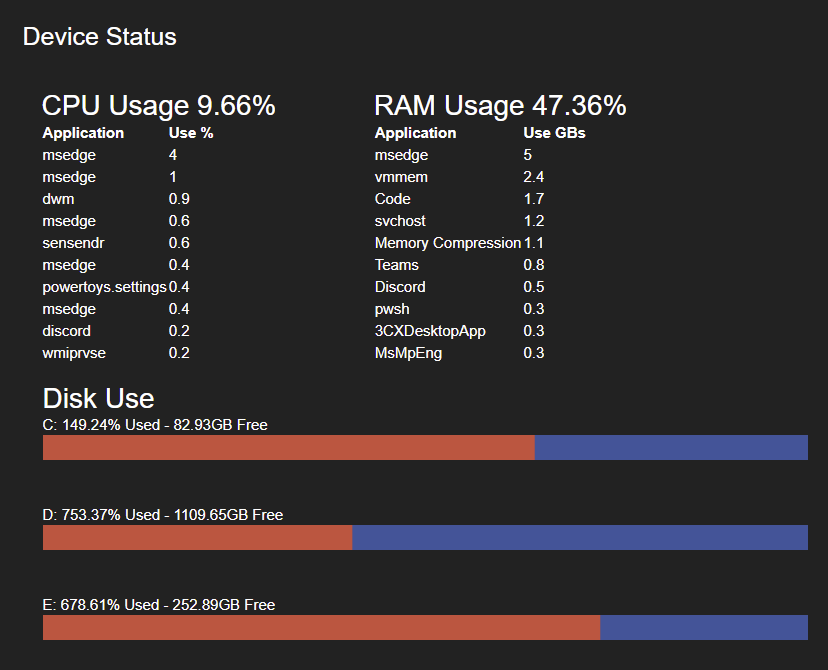
Device Status
This works with a custom component documenting CPU and RAM usage to UDFs to give you a snapshot of what was running and what CPU / RAM usage was at roughly the time the alert was triggered. This should help with issues where something is spiking and causing an issue, but has resolved by the time you can investigate
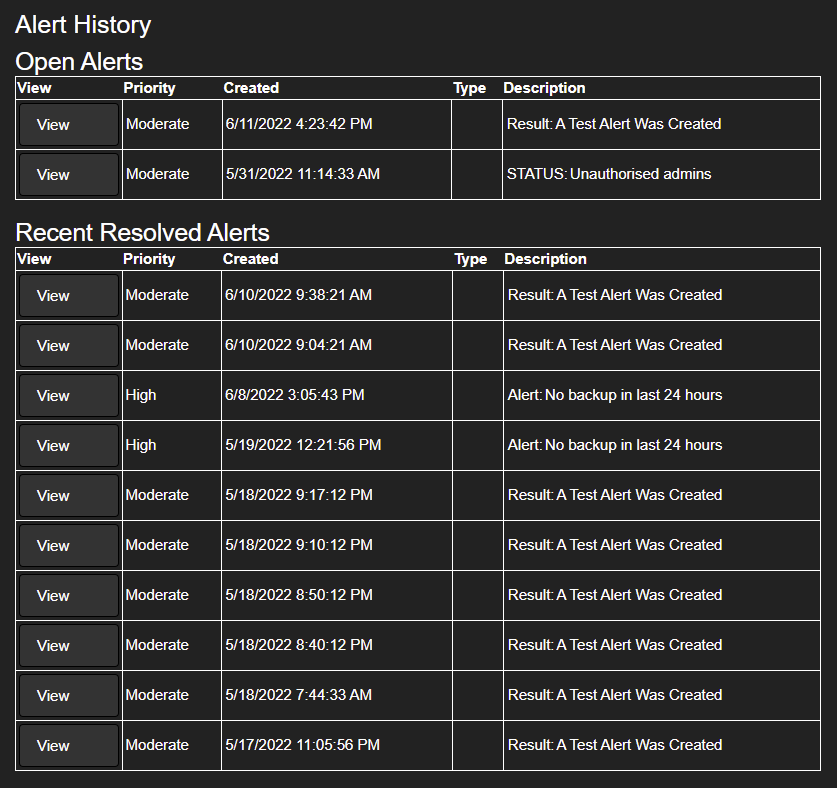
Alert History
This provides some details on recent alerts that have happened on the device and which alerts are currently open on that device
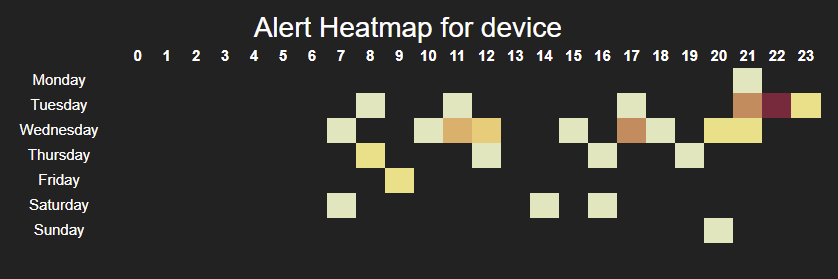
Alert Heatmap
This looks at the entire alert history of the device and generates a heat map of when the most errors on the device occur by day of the week and hour. This can let you see if there are any trends or jobs you need to investigate to adjust your monitoring for or issues you need to fix.
Dynamic Columns
You can set the number of columns that will be rendered in the email to match your ticket system:
For example 2 columns:

3 Columns:

Setup
To deploy this function and start using it yourself please visit the GitHub Repository here: https://github.com/lwhitelock/DattoRMM-Alerts-Email